Wise Analysis: Advanced Reporting Made Simple
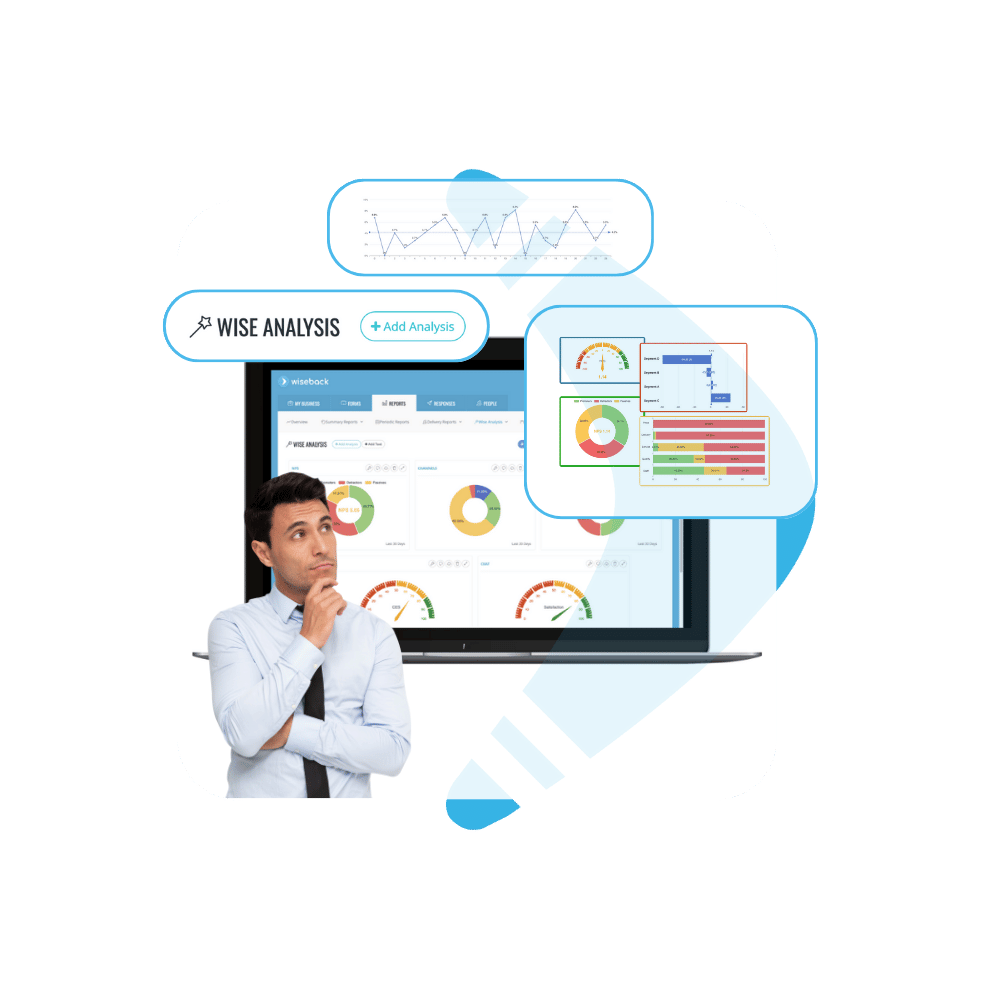
Unlock the power of data with Wiseback’s Wise Analysis feature. Our intuitive drag-and-drop interface allows you to create comprehensive reports effortlessly, tailored to your experience management needs. With over 80 specialized analyses, you can visualize and interpret customer data with precision.
Whether you’re tracking customer satisfaction, pinpointing areas for improvement, or identifying trends, Wise Analysis provides the tools you need to make data-driven decisions that enhance customer experience and drive business growth. Simplify your reporting process and uncover valuable insights with Wise Analysis, empowering your team to achieve exceptional results.

Wiseback » Custom Visual Reporting
Comprehensive Visual Analysis with Wise Analysis
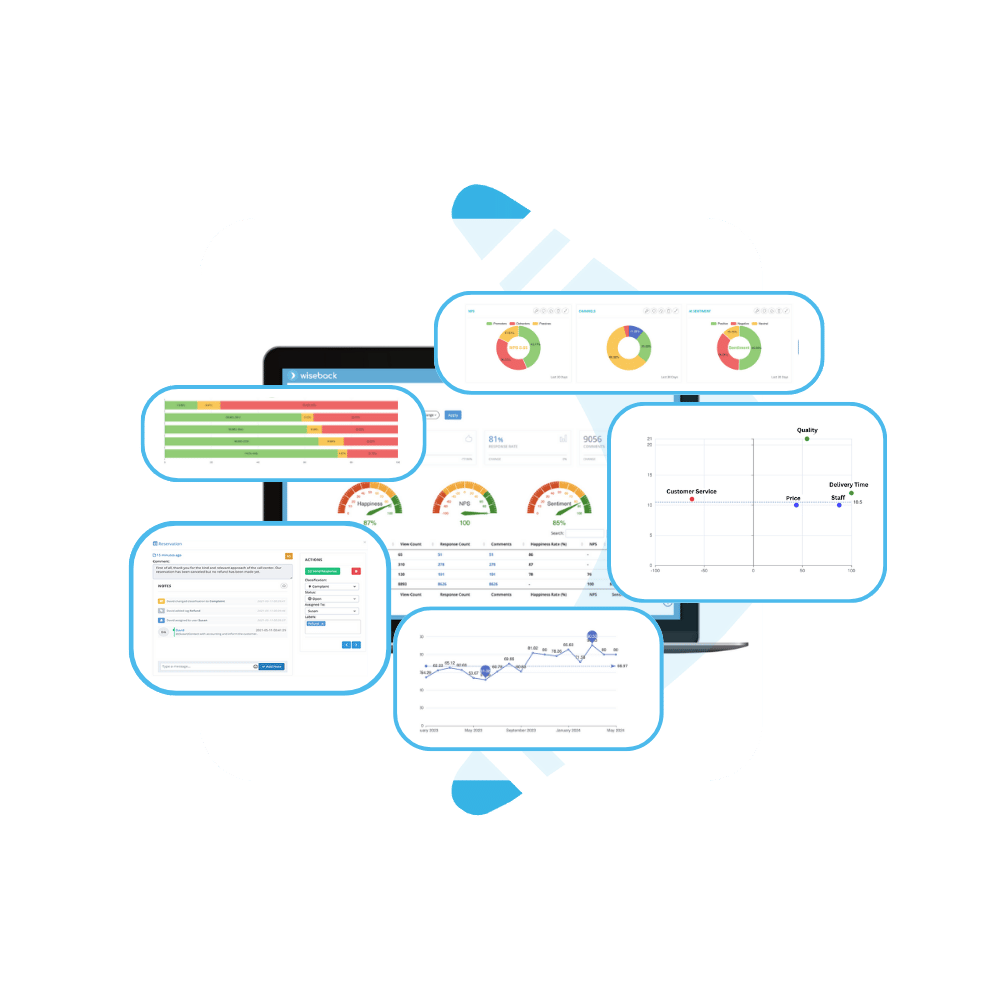
Enhance your data interpretation with Wiseback’s diverse range of visual analysis tools. Our platform offers various visual formats to suit your reporting needs, including bar charts for comparing data points, customizable dashboards for a holistic view of key metrics, dynamic gauges for performance assessment, scatter plots for identifying relationships, line charts for tracking trends, pie charts for illustrating proportions, pipeline charts for visualizing workflows, and word clouds for highlighting frequent terms in feedback. With Wiseback’s robust visual analysis options, you can turn complex data into actionable insights, driving informed decision-making and elevating your experience management strategy.


Effortless Report Creation with Wise Analysis
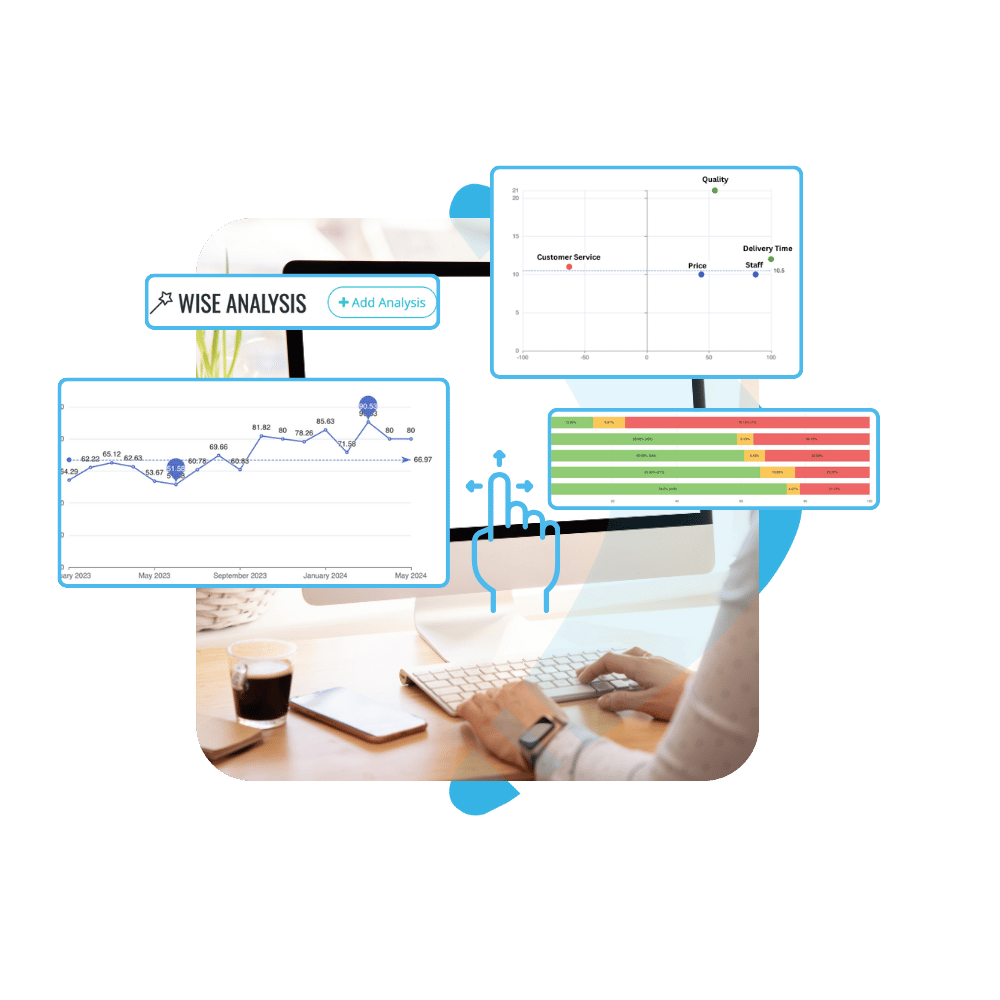
With Wise Analysis, creating comprehensive reports is a breeze. Our intuitive drag-and-drop interface allows you to design reports effortlessly, tailoring them to your specific needs. You can create reports from scratch or copy existing ones to save time and ensure consistency.
Whether you’re visualizing customer feedback or tracking performance metrics, Wise Analysis simplifies the process, enabling you to generate insightful reports quickly and efficiently. Elevate your data reporting capabilities with Wise Analysis and make informed decisions that drive your business forward.
Flexible Filtering with Wise Analysis
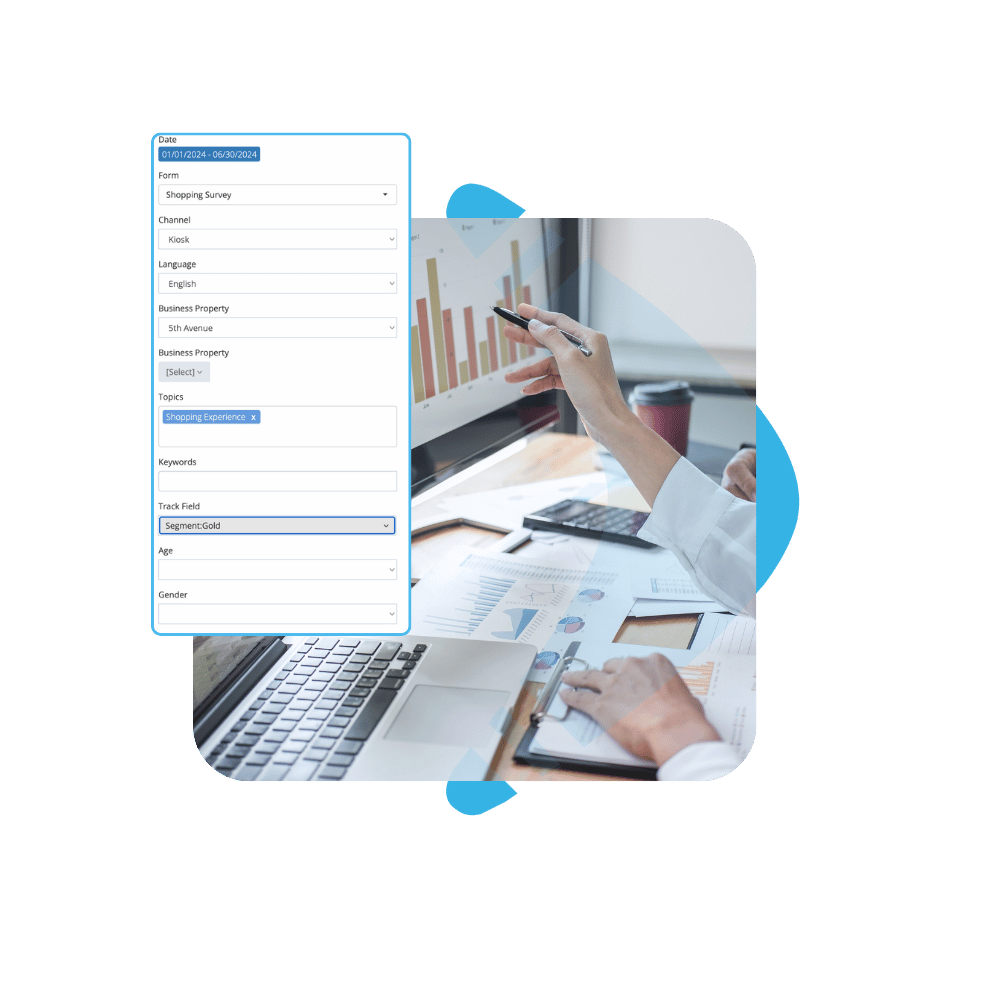
With Wise Analysis, you have complete control over your data visualization. Easily change filters for each analysis individually or apply changes to all analyses simultaneously. This flexibility allows you to tailor your reports to specific needs and gain deeper insights.
Our intuitive platform makes it simple to adjust filters and modify analyses, ensuring you always have the most relevant and actionable information at your fingertips. Elevate your reporting and make informed decisions with the powerful filtering capabilities of Wise Analysis.


Effortless Report Sharing with Wise Analysis
Wise Analysis makes it easy to share your insights. You can send copies of the reports you create to other users with just a few clicks. Additionally, take advantage of our platform’s capabilities to generate PDFs or printouts of your reports effortlessly.
Whether you need to distribute digital copies or physical documents, Wise Analysis ensures your data is accessible and shareable, enhancing collaboration and informed decision-making across your team. Simplify report distribution and ensure everyone stays on the same page with Wise Analysis.
Trusted By Leading Brands


Elevate Your Business
Discover how our experience management solutions can benefit your business.